
I had a chance to watch an interesting presentation by Kentik in NFD-31 online back in April 2023. I have been attending NFD events organized by Techfieldday events for quite some time as a delegate. However, this time around, I just watched the presentation as a viewer ( not a delegate)
Kentik has been coming regularly to these events. The last one where I was a delegate was the NFD service provider two in August 2022, and Kentik presented there too.
For a while, I wanted to write about Kentik considering their unique approach to “network observability.” The presentation in NFD-31 by Phil Gervasi about “Data-driven network visibility with Kentik” clearly and well-explained how Kentik solves the network observability challenge. Thus it became a good inspiration for me to write a piece about Kentik.
For those who do not know about Kentik:
Kentik solves network operations problems using a data-driven approach called network observability.
Kentik Network Observability Cloud platform is their flagship SaaS solution. Which analyzes a large amount of data from various sources and uses machine learning techniques to classify, cluster, scale, and normalize the data. The goal is to provide useful and insightful information to help network engineers resolve issues quickly.
This approach differs from point solutions in the market, providing a narrow network view. More on it in a moment.
Before we discuss further, we should understand the industry drivers:
Do you know what is the biggest challenge of enterprises today?
No matter how important the network is today, they do not own it.
Really?
Yes, with the cloudification of applications, the services now reside in private or public clouds. Many applications have moved to SaaS.
Network owners have become dependent on networks beyond their premises and their control.
As enterprises march towards digital transformation to provide new and innovative services and strive to improve the customer experience, they must ensure that the network ( even if they do not own it ) and applications perform well.
This was quite different in the old days.
Earlier, finding the issues was easy; the network was within an enterprise’s control. Now the network has many pieces, the internal network, the public network, SaaS, security devices, load balancers, DNS, IPAM, containers, etc.
Getting visibility across all of them is indispensable. At the same troubleshooting has become complex.
The traditional monitoring and testing tools do not suffice here. The monitoring tools give a partial view of the network. This would require multiple tools to get end to end view of the network.
There is a lot of data. However, correlating them to find the root cause is a challenge. Numerous disparate databases and point tools further slow the network management and troubleshooting process.
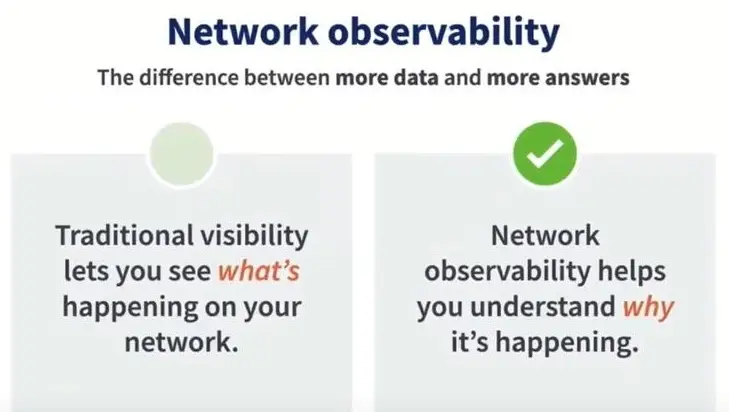
This requires “observability,” as Kentik calls it. Observability runs at the heart of Kentik tools.
Network observability provides a greater level of visibility and context compared to traditional visibility. It involves using tools and techniques, such as data science and database architecture decisions, to understand why something is happening in the network.
Observability does not involve making changes to the system but observing and analyzing production and user traffic. Additionally, active monitoring tests the network without relying on production traffic or user complaints.
How Kentik is different?
The following diagram nicely summarizes what Kentik does.
The strength of the Kentik is first in collecting the data from many diverse sources, which would otherwise require multiple tools. This includes the NETWORK DATA sources such as routers and switches and APP DATA like CDNs, containers, hypervisors, and servers. And if that is not enough, they can take BUSINESS DATA also like CRM, OSS, BSS, etc.
The data goes to a big repository where data is ingested and fused. In other words, data received from customers is appended with additional data such as GeoIP and BGP, which gives additional context data.
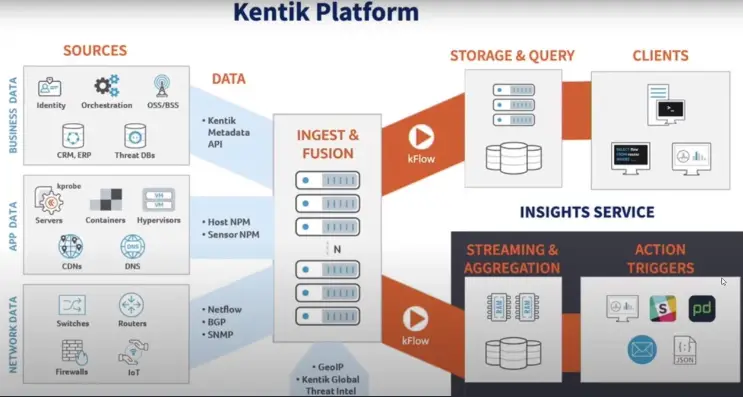
However, Kentik goes one step further; it analyzes and correlates multiple data sources to provide meaningful insights into what is going on in the network.
It presents charts and statistics about anything related to the network and application it collected, from which pinpointing the exact problem becomes easier.
It can help answer questions like
Why application is slow?
Which ASN is adding to the latency?
Why a page is taking longer to load?
Is application degradation came because of Jitter?
Last but not the least? Is it a network issue or an application issue?
The synthetic test is one of the nice features of the tool, through which traffic can be inserted into the network to see the performance of test traffic, thus simulating user experience.
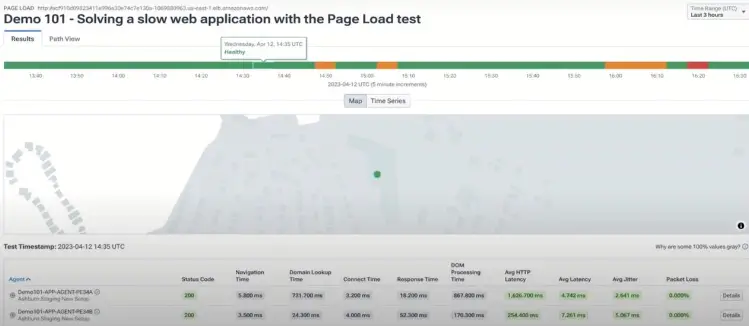
Phil explained the functionalities of the Test Control Center, highlighting the ability to identify and troubleshoot issues before they impact end users. He gave an example of using a Page Load Test to identify high latency and traced it back to a specific file causing loading delays. The historical data can be shown in time series, as in the following picture,, and periods when the user experience went bad with the page load.
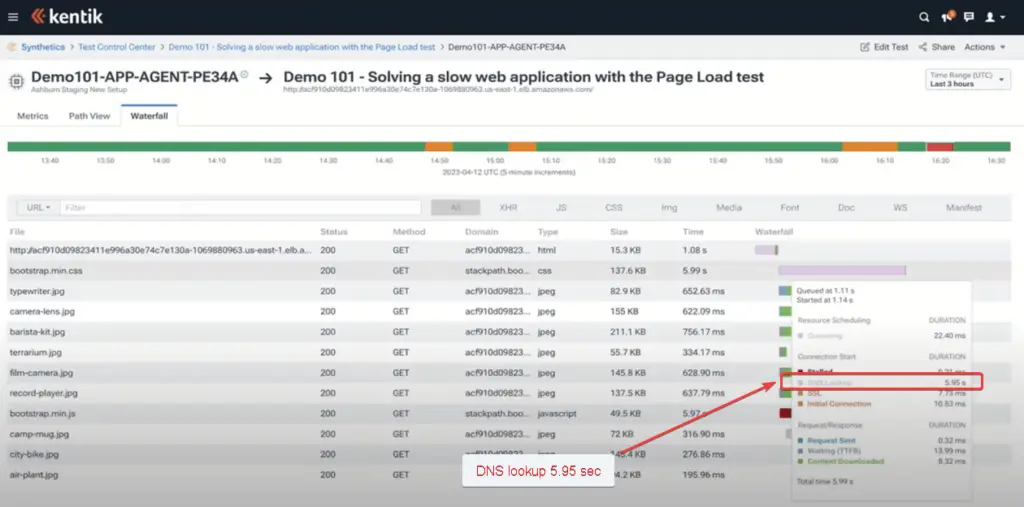
Phil showed how easy it is to drill down using the waterfall method for a particular .js file showing issues. It was found that the file seemingly had trouble resolving DNS ( DNS load time of around 6 seconds), resulting in an overall slowdown of the application. Phil emphasized that such issues could be fixed before users experience them, ensuring a smooth running system.
What are the advantages for enterprises and Service Providers?
As you may have seen, Kentik removes the guesswork in network troubleshooting.
You do not need tens of engineers and tens of tools to find out issues in the network.
Even if you have tens of tools, arriving at the root cause of the solution is lengthy., time-consuming, and manual.
Digital transformation is all about services, agility, and customer experience. When customer experience matters, time is of the essence.
Kentik fills visibility gaps and prevents disruptions in internal networks and cloud environments. It helps network owners stay agile and proactive. Kentik Network Observability Cloud empowers professionals to plan, run, and fix any network. With this platform, they can easily identify where the traffic was impacted and take corrective actions. Reliable networks and a great digital experience are ensured.
Disclaimer: This is my own analysis. The vendor did not ask for nor were they promised any consideration in the writing of this post. This is not a sponsored post. My conclusions here represent my own thoughts and opinions.